Description
The Warehouse Information Service (W.I.S.) is A&A’s premium value-added warehousing market research and analysis offering. It’s the only subscription in the marketplace providing you with strategic insight into how your warehousing pricing compares against the North American Third-Party Logistics industry. Leverage A&A’s proprietary benchmarks, market intelligence, real-time operational assessment, and interactive data sets to enhance your current or proposed pricing and positioning strategies. The Warehouse Information Service is your own market guru and personal Pricing Manager.
The Warehouse Information Service includes three downloadable files: the comprehensive version of our report The Business of Warehousing in North America – 2021, an interactive Warehouse Pricing and Operations Benchmarking Tool in MS-Excel, and an interactive Warehouse Benchmarking Score Card in MS-Excel.

The Business of Warehousing in North America – 2021 (Comprehensive Version)
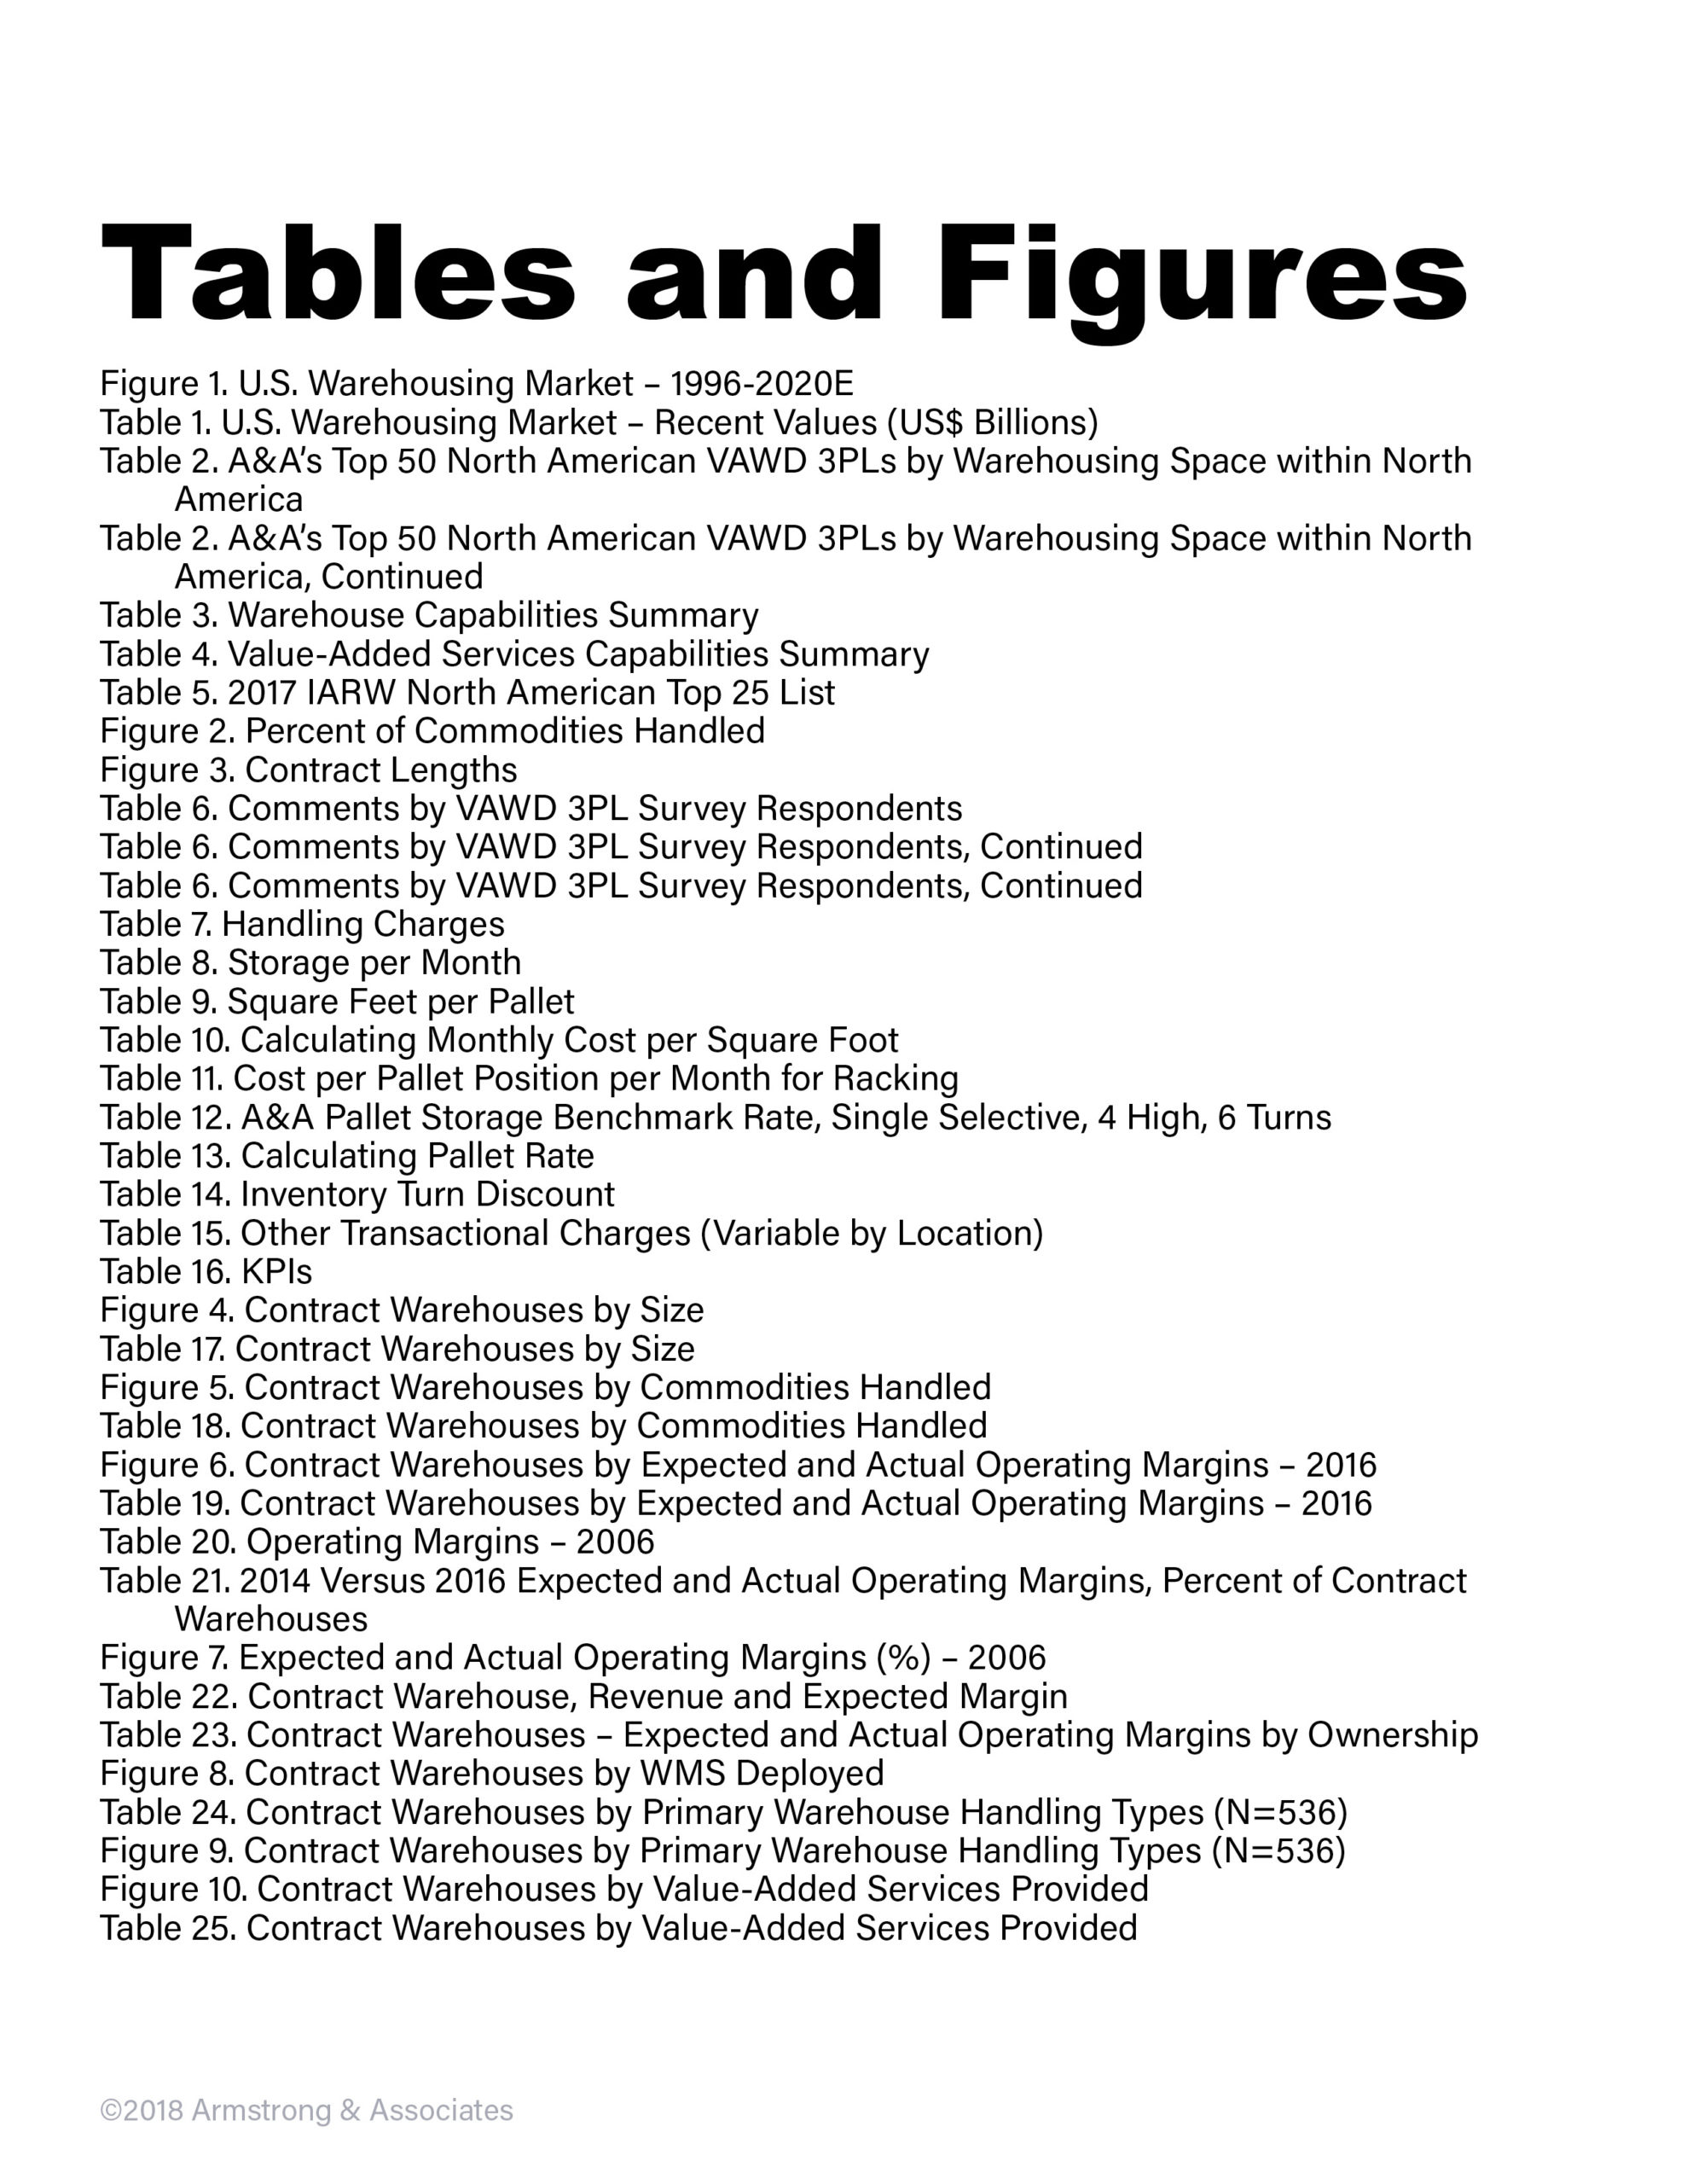
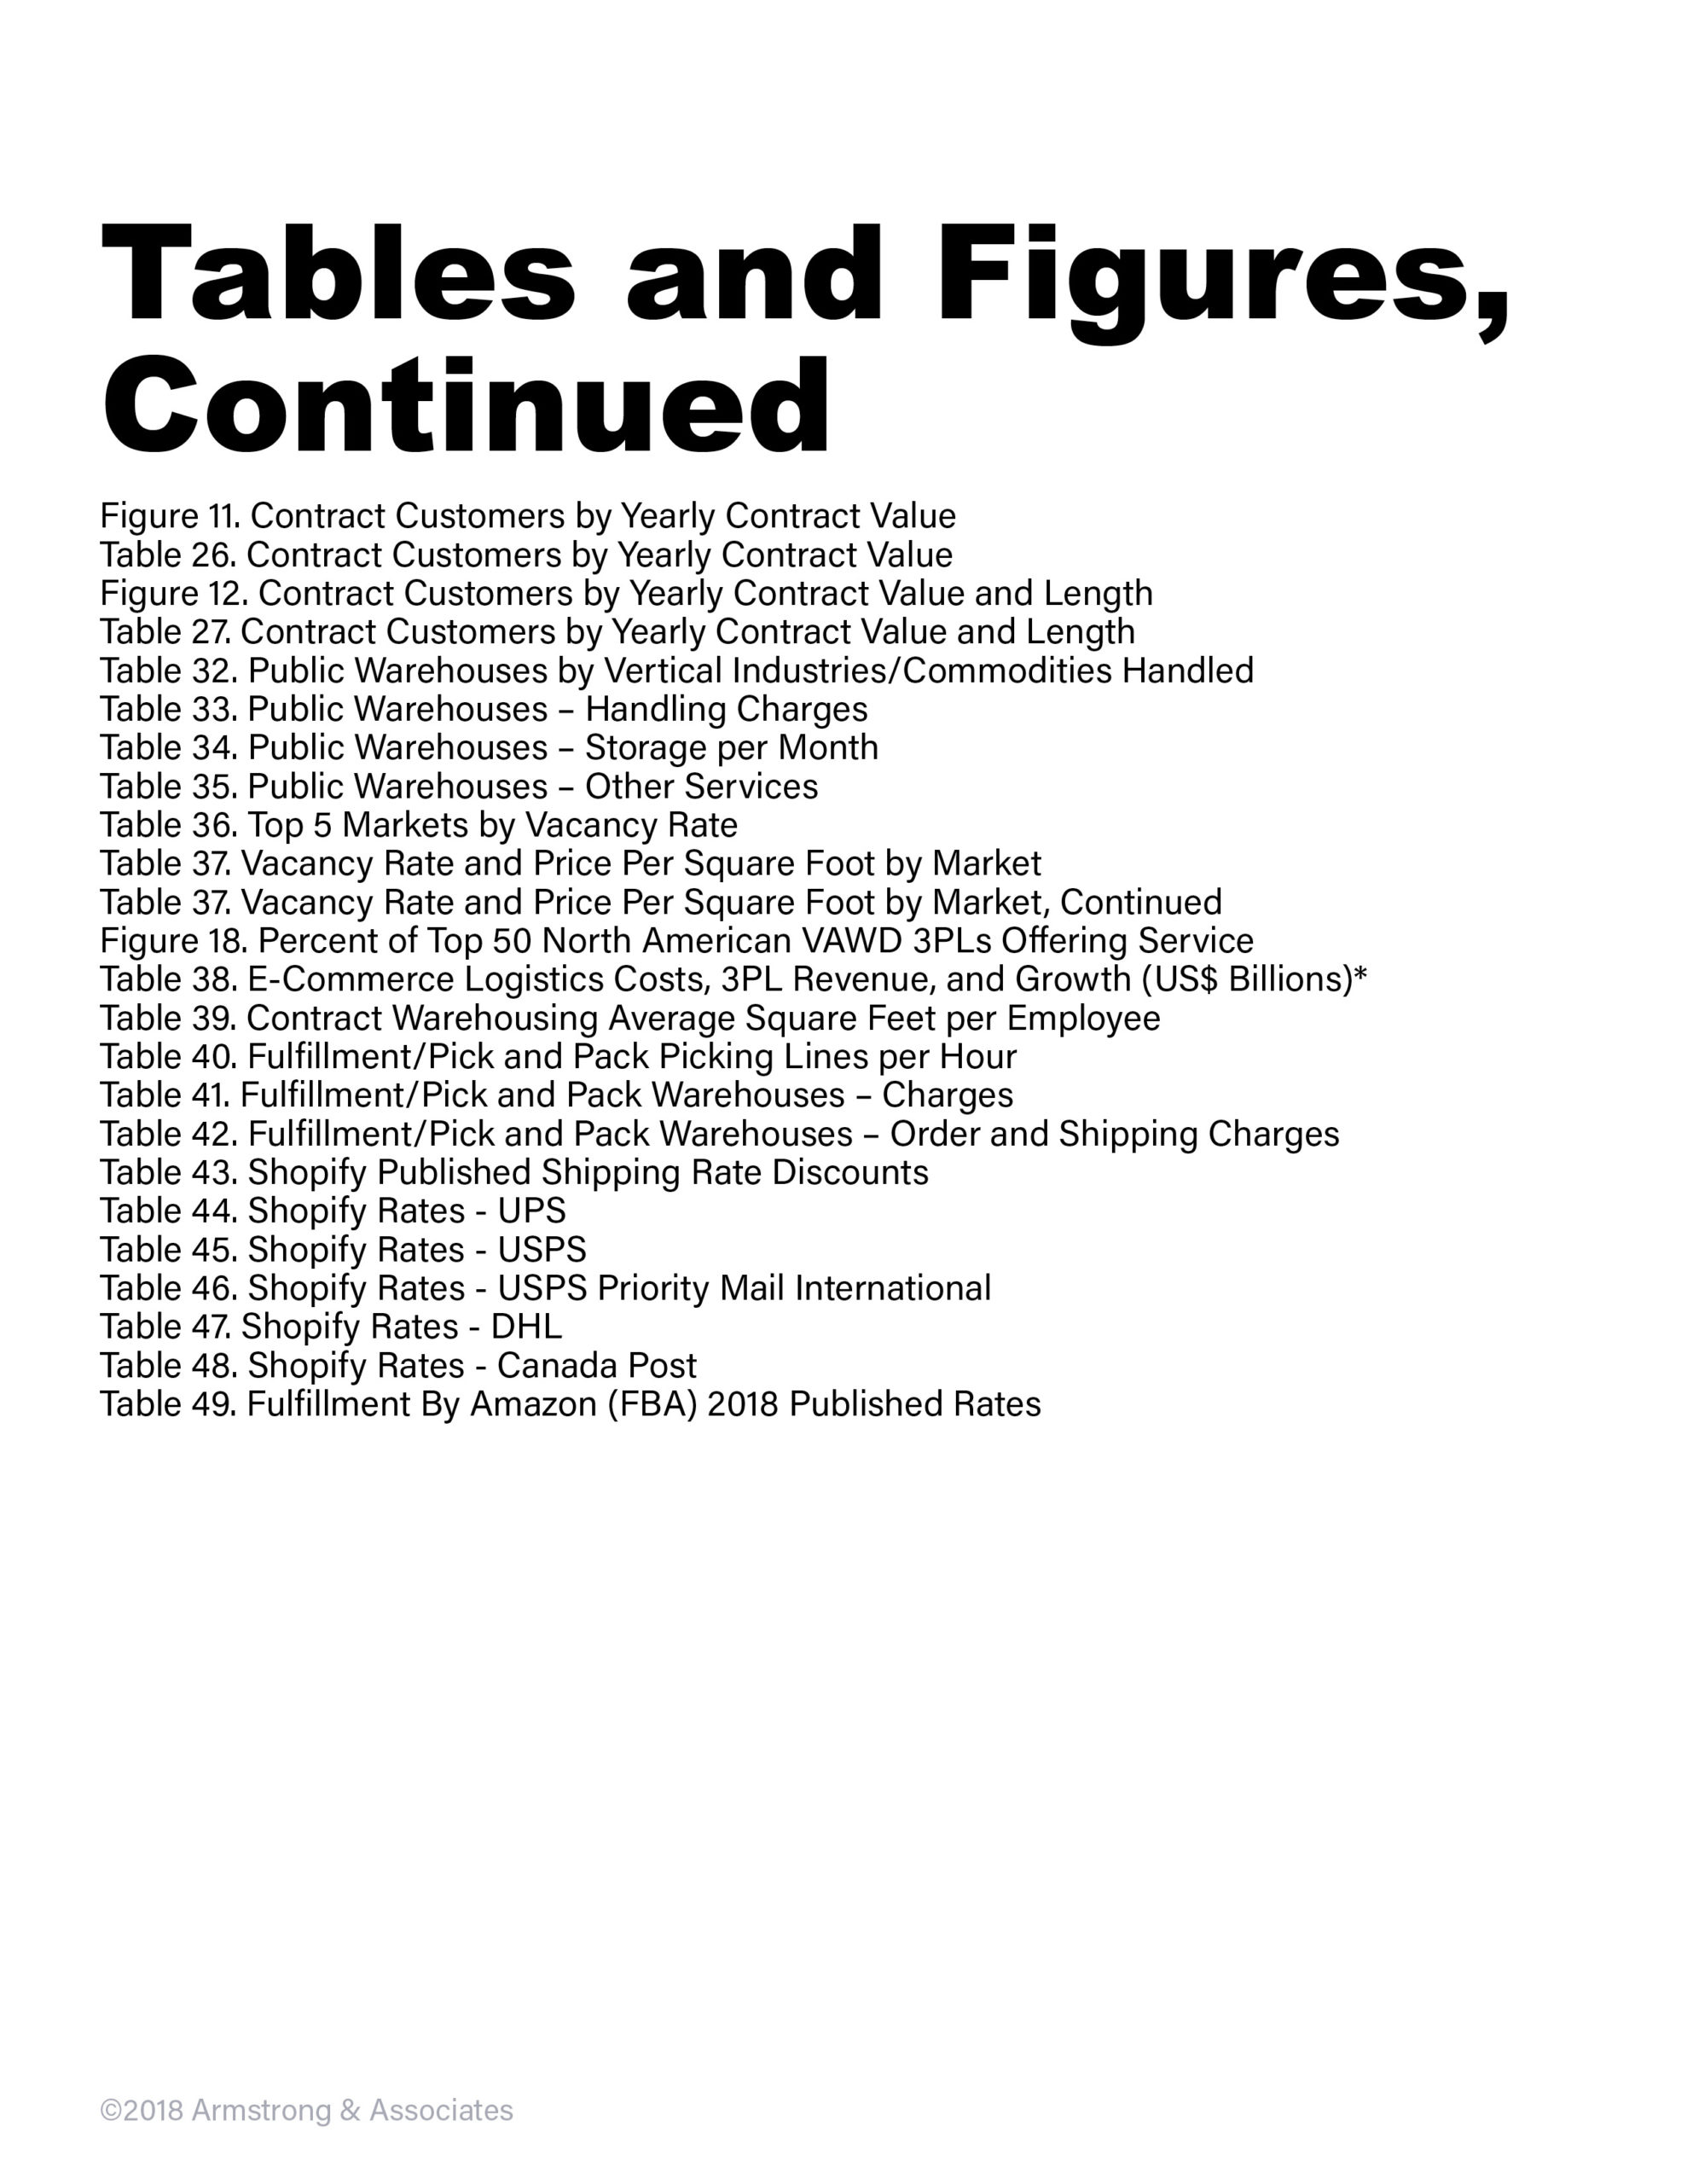
This major market research report on North American warehousing provides updates on facility sizes, capacity, revenues, pricing (including e-commerce rates), and commodities handled. Operating margins are provided for contract warehousing operations. Expected operating margins and profitability measures are compared to actual results. Statistical analyses detail the effects of open book relationships and leasing, versus ownership on overall warehouse profitability. E-commerce logistics costs, 3PL revenue, growth rates, and for the first time, e-commerce fulfillment benchmark rates are also covered. In addition, warehouse rents and vacancy rates, customer service trends, key performance indicators, value-added services and warehouse management systems used and A&A’s list of Top 50 North American Value-Added Warehousing and Distribution (VAWD) third-party logistics providers list is included. (Note: This report is downloadable as an Adobe PDF file with a single user license.)
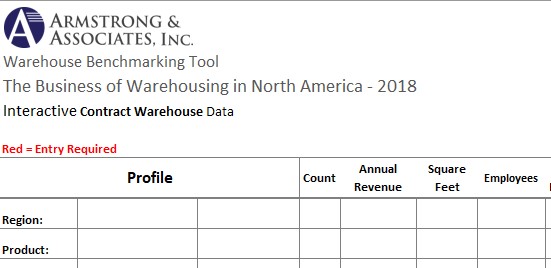
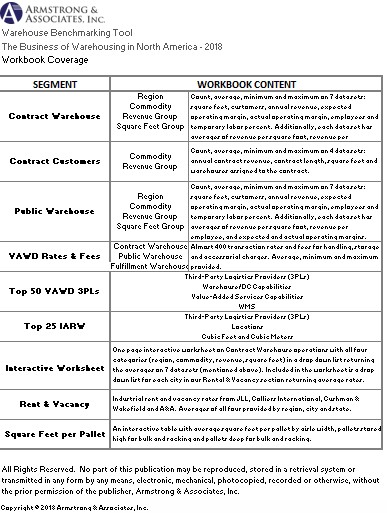
 The Warehouse Pricing and Operations Benchmarking Tool is neatly organized into nine interactive spreadsheets and contains over 6,000 data points. It allows you to benchmark warehousing operations financial performance against the North American Third-Party Logistics industry for variables such as industry/commodities handled, square footage required, and the number of employees per warehouse. The resulting industry comparative benchmarks include expected operating margins, revenue per square foot, and revenue per employee. (Note: This data is downloadable as a Microsoft Excel file with a single user license.)
The Warehouse Pricing and Operations Benchmarking Tool features include:
- Contract and Public Warehouses: Filter by single variable, or all four groups of: 1 – Region, 2 – Commodity, 3 -Revenue Group, and 4 -Square Feet Group. Secondary filter on averages of annual revenue, expected and actual operating margin, number of customers, square feet, average employees, and temporary labor percent.
- Contract Warehousing Customers. Filter by single variable, or groups of; 1 – Commodity and 2 – Revenue Group. Secondary filter on averages of annual revenue, square feet assigned to the contract, contract term and warehouses assigned.
- Who can benefit from the benchmarking information:
- Pricing engineers for margin, revenue per square foot and revenue per employee
- Sales, to help identify the “negotiation zone”
- RFP/RFI proposal management
- Staff performing warehouse financial audits
- M&A due diligence analysts
- Who can benefit from the benchmarking information:
- 3PL Value-Added Warehousing & Distribution Rates and Fees. Filter on Contract Warehouse, Public Warehouse and Fulfillment Warehouse with a secondary filter on all accessorial, handling and storage fees returning average, minimum and maximum fees.
- Benchmark the following areas:
- Current rates
- Existing and proposed pricing
- RFP/RFI expected rates and fees
- Information for financial audits
- M&A due diligence performance metrics
- Benchmark the following areas:
- Rental and Vacancy
- Benchmark rental and vacancy rates for pricing
- Benchmark rental and vacancy rates for proposed rate increases
More advanced data reporting and analysis includes:
- Utilize the included Warehouse Benchmarking Score Card to compare your warehousing operation to the industry in the following areas:

- Performance versus expected and actual operating margins
- Revenue targets per employee and by square foot
- Warehouse revenue, square feet, employees, temporary labor percent
- Customize your analysis to include performance KPIs, such as warehouse capacity utilized, inventory accuracy, and on-time shipping.
(Note: This data is downloadable as a Microsoft Excel file with a single user license.)
- Operating Margin Worksheet/Calculator:
- Develop a base-line operating margin using multiple categories and sub-categories. Perform different pricing sensitivity analyses for detailed risks and rewards categories.
- Use it to support annual and quarterly business reviews comparing customer specific warehousing pricing to industry data.
- Develop a warehouse Operating Margin Strategy. Set a warehouse strategic margin target from benchmarking data.
- Calculate operating margins based upon supply and demand. For example, the largest percent of warehousing contracts are between $1M and $3M. Operating margins dip as the supply increases, as the supply decreases margin starts to increase again.
- By utilizing the calculator, your staff will become proficient in calculating target operating margins and negotiating contracts.


